John Errington's Data Conversion Website
Sampling rate
The choice of sampling rate is determined from the highest frequency present in significant amount in the signal. For audio signals we may have frequencies to above 50kHz, but only want to respond to 20kHz and below. In this case filtering would be needed to remove these high frequencies before sampling takes place. The strategy chosen determines the number of samples taken during 1 period of the highest frequency present in the signal.
( The period is the time taken for 1 full cycle of a repetitive wave. The envelope modulation approach gives useful sampling rates with good accuracy for most applications. Also referred to as oversampling.
| Strategy | no of samples per period | samples per period for 8 bit converter | Explanation |
| Every reading precise | 800 | Used for non-repetitive signals where extreme precision is required | |
| Nyquist criterion | 2 | 2 | Used for very repetitive signals; lower limit of sampling rate |
| Envelope modulation | exp 0.374 n | 20 | Chosen to match sampling error to resolution or measurement error inherent in converter |
Here you can see the effects of sampling a sine wave at different rates.
|
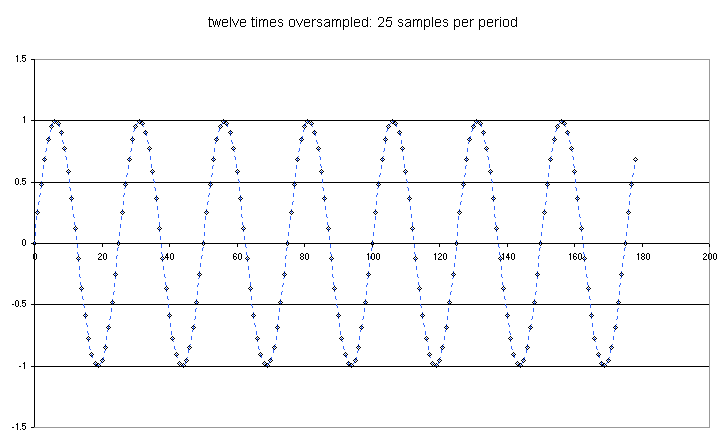
This graph shows a sine wave generated using 25 samples per cycle. This corresponds to 12 times oversampling, and approximately matches the envelope modulation criterion. You can see that within one cycle both the shape and amplitude of the wave are very well defined.
|
 |
|
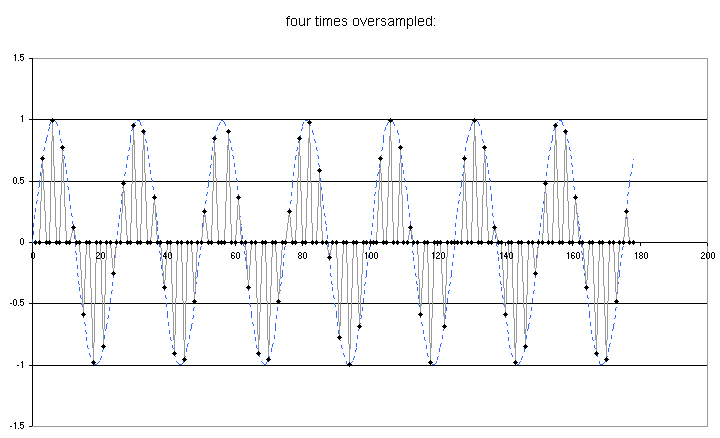
Here you can see the sine wave generated above being sampled at around 8 samples per period. If you look at the second wave you will see there are no samples at the peak. So within one wave this sampling rate does not guarantee an accurate measure of the amplitude. However the frequency of the wave is quite clearly defined. |
 |
|
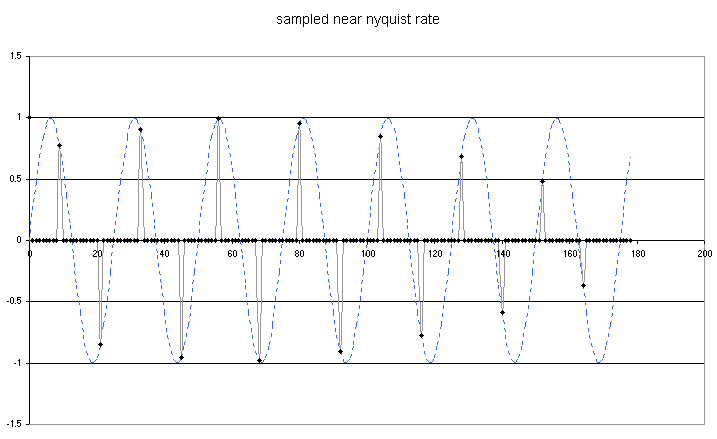
This graph shows the effect of sampling at just over two samples per period. This is the Nyquist rate, the lowest sampling rate at which the wave will be correctly represented. You can see that it is not possible to measure either the wave frequency or amplitude with any degree of accuracy before a few cycles of the wave have elapsed. However during the course of a few cycles we can build up a fairly clear picture of the amplitude and frequency of the wave. The Nyquist criterion gives us the bare minimum information and is only useful for observing signals that repeat many times without changing much. |
 |
|
Here you see the effect of sampling at less than the Nyquist rate. Not only do we not get an accurate picture of the amplitude, but the results give us a completely inaccurate idea of the signal frequency. This is the real value of the Nyquist theorem in showing there are sampling rates which will give us false information. |
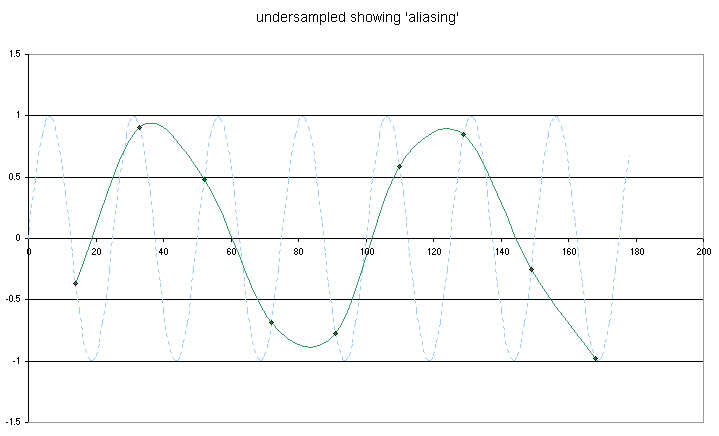 |
If you dont follow the math in the next section, or arent interested in the proof, just scroll down to the result in each section, marked ***.
Important terms:
1: RANGE - the difference between maximum and minimum values allowable at the input of the ADC;
2: Resolution interval - denoted q - the smallest change that can be measured; the range divided by the number of possible values at the output of the ADC
EXAMPLE: The Arduino UNO has a 10 bit ADC that can read 0 - 5V (RANGE = 5V - 0V = 5V)
Resolution: 10 bits is 0b00 0000 0000 to 0b11 1111 1111 - that is 2^10 = 1024 values
Resolution interval q = 5V / 1024 = 4.88mV
Every reading precise
If each reading must be accurate to the precision of the converter, then the input signal may not change by more than one resolution interval q during the time t taken for the measurement.
We can represent this as dv/dt < q / t.
A sine wave matched to the full scale range of the converter can be represented as v = ( RANGE / 2 ) sin 2 ![]() f t
f t
by differentiating dv/dt = 2 ![]() f (RANGE / 2) cos 2
f (RANGE / 2) cos 2 ![]() f t
f t
and dv/dt (max) = 2 ![]() f (RANGE / 2) as max value of cos = +/- 1
f (RANGE / 2) as max value of cos = +/- 1
now q = RANGE / 2^n
so at the limit 2 ![]() f RANGE / 2) = ( RANGE / 2^n ) / t f = (1 / 2^n
f RANGE / 2) = ( RANGE / 2^n ) / t f = (1 / 2^n ![]() t)
t)
if we let f =1 / T where T is the period of the sampled wave, then we get T = (2^n ![]() t) showing
t) showing
*** we need 2^n  samples per period. This is 800 samples per period for an 8 bit converter!
Nyquist criterion ( sampling theorem)
The information present in a signal can be recovered by taking at least 2 samples in every period of
the highest frequency present in the wave, over a large number of periods.
NOTE: the nyquist criterion ONLY APPLIES for signals that are STRICTLY BAND LIMITED and last a considerable time - many periods of the wave.
*** we need to exceed 2 samples per period.
Envelope modulation analysis - (often the best guide to sampling rate)
When we sample a wave we multiply the incoming wave by a sampling wave with a value of 1 at the sample points and 0 elsewhere. Signal processing theory allows us to write an expression for the sampled wave.
If we sample a signal v = f ( t ) at regular intervals ts using a converter that takes a time tc for conversion, the signal is modified by a factor
Venv ( f ) = 2 ( tc / ts ) * ( ( sin ![]() tc f ) / (
tc f ) / ( ![]() tc f ) )
tc f ) )
This results in a measurement error ![]() V / Vpeak = 1 - ( ( sin
V / Vpeak = 1 - ( ( sin ![]() tc f ) / (
tc f ) / ( ![]() tc f ) )
tc f ) )
we can expand sin(x) using the MacLaurin expansion sin( x ) = x/1! - x3/3! + x5 /5! - ..,
whence sin( x ) / x = 1/1! - x2/3! + x4 / 5! - x6/7! + ...
![]() V / Vpeak = (
V / Vpeak = ( ![]() tc f )2 / 3! - (
tc f )2 / 3! - ( ![]() tc f )4 / 5! + (
tc f )4 / 5! + ( ![]() tc f )6 / 7!
tc f )6 / 7!
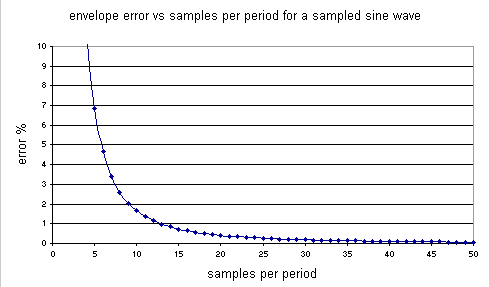
By substituting in values we can show that for a converter with a conversion time of 50 microseconds, and a wave frequency of 1kHz (giving 20 samples per period) we get a measurement error of 0.41%. This is comparable with the measurement accuracy of an 8 bit converter.
If we let the period of the wave be T = 1 / f
![]() V / Vpeak = (
V / Vpeak = ( ![]() tc / T )2 / 3! - (
tc / T )2 / 3! - ( ![]() tc / T )4 / 5! + (
tc / T )4 / 5! + ( ![]() tc / T )6 / 7! and if tc / T < 0.1 we can ignore higher terms, and error is given by
tc / T )6 / 7! and if tc / T < 0.1 we can ignore higher terms, and error is given by
measurement error = ![]() V / Vpeak = (
V / Vpeak = ( ![]() tc / T ) 2 / 3! approximately, where ( tc / T ) = (1 / samples per period.)
tc / T ) 2 / 3! approximately, where ( tc / T ) = (1 / samples per period.)
*** For an n bit converter the number of samples per period should exceed Nsamples = exp 0.374 n
The chart that follows shows the measurement error for different sampling ratios.
| converter resolution for n bits | ||
| n bits | levels | resolution, % of FSR |
| 1 | 2 | 50 |
| 2 | 4 | 25 |
| 3 | 8 | 12.500 |
| 4 | 16 | 6.2500 |
| 5 | 32 | 3.1250 |
| 6 | 64 | 1.5625 |
| 7 | 128 | 0.78125 |
| 8 | 256 | 0.390 |
| 9 | 512 | 0.195 |
| 10 | 1024 | 0.098 |
| 11 | 2048 | 0.0489 |
| 12 | 4096 | 0.024 |
| 13 | 8192 | 0.012 |
| 14 | 16384 | 0.0061 |
| 15 | 32768 | 0.0030 |
| 16 | 65536 | 0.0015 |
